Table of Contents
Ethereum (ETH), the second-largest currency by capitalization, shows signs of an Ethereum bullish breakout into short-term prices above $3,000. Bitcoin has recently surged to a new all-time high, driving a broader market rally, raising the entire crypto sector, and restoring investor confidence.
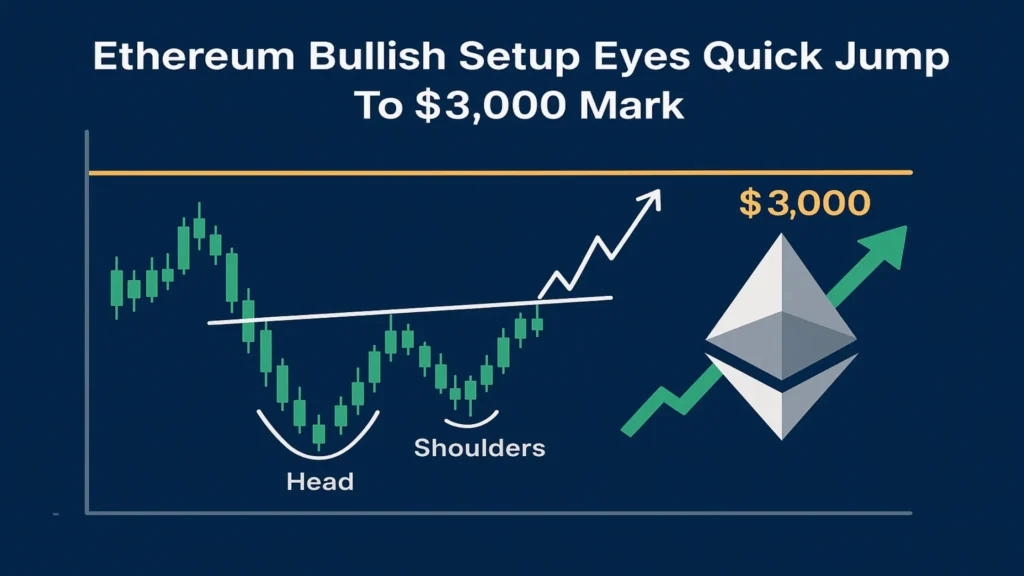
A crypto analyst of considerable repute, Ted Pillows, noted a massive chart pattern forming on the 12-hour chart of Ether. Such a pattern, called the inverse-head-and-shoulders, is known as a strong bullish reversal in many financial markets. According to Pillows, Ethereum is very close to moving past a crucial resistance level, which could then see it rise by more than 17% from current levels.
Ethereum Price Rally: The Numbers So Far
In recent weeks, Ethereum has taken a significant stride forward. During this month, the alt has appreciated by 44.69% and is undergoing strong bullish momentum with some buyer interest. The past week has added about 3.16% price appreciation, making it one of the few exceptions among altcoins.
According to the analysis of market data, on May 26, Ethereum was priced at around $2,500. This reflected an increment of 0.34% compared to the previous day’s price. So while prices have risen in the last 24 hours, volumes have dropped precipitously, losing almost 58.22%, to lie at $12.35 billion, according to CoinMarketCap. This is a brief pause in activities after the initial fomo, with Ethereum bullish breakout price consolidation forming a positive note.
Bullish Technical Formation: The Inverse Head-and-Shoulders
The big thing that captivates traders’ attention is the appearance of an inverse head-and-shoulders pattern on the 12-hour TradingView charts, which Ted Pillows highlighted on the social media platform X (formerly known as Twitter) on May 24.
This technical pattern generally consists of the following:
- The Left Shoulder: Price dips and rebounds.
- The Head: A deeper drop in price and another rebound.
- The Right Shoulder: A smaller dip and rebound, mimicking the first.
For Ethereum, the description stands as:
- The left shoulder was created in February 2025, when ETH saw a sharp downward move in prices of about $2,000 and then bounced back to trading within a very narrow band for the rest of the month.
- The head was formed in early April when prices crashed to $1,400 to representing the lowest point of this pattern.
- The right shoulder is currently forming, with ETH having bounced back up to around $2,700 and now consolidating just below this key resistance, signaling a potential Ethereum bullish breakout.
Pillows noted the downside of $2,700 as being the neckline of the pattern — the resistance that, if broken, would confirm a breakout of the pattern. Usually, a confirmed breakout from an inverse head-and-shoulders pattern is followed by a strong bullish trend, while the current aim is targeted at $3,000, about a 17.4% gain based on the breakout level.
Analyst Insights: Ted Pillows’ Forecast
Ted Pillows, a renowned name in the crypto community, highlighted this on May 24 in a tweet:
“Ethereum is aligning perfectly with the classic inverse head-and-shoulders structure. If bulls can push past $2,700 with convincing volume, I fully expect a rapid run to $3,000.”
He observes that Ethereum has again and again tested the $2,700 resistance level in recent weeks but has not been able to maintain above it. This repeated testing is a key signal of an Ethereum bullish breakout. But lastly, sometimes when resistance is tested repeatedly, it can increase the pressure on the resistance and may break out at the next try.
Exchange Flows and On-Chain Activity
As recent data emanating from the on-chain analytics space was thrown into the mix by the Sentora platform, several signals emerged that seem to be somewhat contradictory:
- Exchange Deposits: More than $74 million was deposited into centralized exchanges in Ethereum for the first time in over four months. After months of negative net flows, the time could be ripe for holders to cash out or partake in trading.
- Network Activity: Network fees in Ethereum went down by 23.9%, which corresponds to a decrease in network activity. At least in part, this may have something to do with reduced transaction volumes on the DeFi and NFT fronts.
A drop in network activity can sometimes show waning demand, but, of course, some analysts interpret this drop as simply another phase in the market cooldown after the prolonged rally. Yet, the parallel price action of ETH has not dropped off substantially after the aforementioned exchange inflows, which acts as testimony to another hidden strength in the market and somewhat bullish conviction.
Ethereum’s Position Within the Market Rally
Positive sentiment from the overall market also propels upward movement for Ethereum. The recent surge past its previous all-time high by Bitcoin has acted as a domino effect, placing several altcoins in the spotlight, especially Ethereum. Whenever Bitcoin takes the lead in a bullish rally, it is mostly observed that large altcoins follow through with certain trade activity, nicknamed “altcoin season.”
This momentum supports the ongoing Ethereum bullish breakout. With strong fundamentals, including being the leading medium for smart contracts and the decentralized applications ecosystem, Ethereum continues to be a favorite of long-term investors. It also switched to PoS, along with a reduced issuance rate after the Ethereum Merge, thus adding some deflationary pressure to favor price appreciation.
Market Commentary From Other Analysts
Other experts are also weighing in on Ethereum’s outlook. During his podcast, crypto strategist Scott Melker, familiarly known as The Wolf of All Streets, said:
“The inverse head-and-shoulders on Ethereum is just textbook. If ETH breaks its $2,700 neckline with good momentum, it could quickly move to challenge the $3,000 level. This signals a strong Ethereum bullish breakout, and from there, $3,500 would not be so far-fetched, provided the broader market holds.”
Ethereum’s Path Forward: What to Watch
A few key developments to keep an eye on are as follows:
- Price Reaction Around $2,700: This level can become an actual Ethereum bullish breakout after a strong daily close with high trading volume.
- Volume: Volume must increase with the price movement to confirm pattern trades.
- Macro Trends: Bitcoin and U.S. macro indicators, such as interest rate decisions and inflation data, must be considered. They largely influence crypto sentiment.
- Ether Gas Fees and Network Activity: Higher network activity can bring along demand and price action.
Ethereum Poised For Bullish Continuation?
Technically and psychologically, the present moment is marking the zonal tipping point for Ethereum. Any breakout beyond $2,700 should clear the pathway toward the next leg higher of approximately $3,000, which the market has not seen since 2024’s early part. Strong bullish chart patterns support this rising potential, along with the bullish momentum generated by the Bitcoin rally and investor confidence. This combination indicates a possible Ethereum bullish breakout.
At the same time, traders are warned to keep a watch on the volumes and market confirmation for this breakout before getting into sizable positions. As always, however, crypto markets are still volatile, and though technical patterns can point a trader in the right direction, nothing is set in stone.
ETH is currently consolidating below a strong resistance where analysts call for continued bullish strength; hence, the next several days could be the make-or-break time for ETH to break out and trap enough momentum for further advances to $3,000 and beyond.


